Real-time Analytics Dashboard
Web · Data Viz · 2023
Günlük 50.000 aktif kullanıcıya hizmet veren bir SaaS platformu için canlı analiz panosu. Metrikler WebSocket aracılığıyla her saniye güncelleniyor. React, D3.js ve Go arka uç ile geliştirilmiştir.
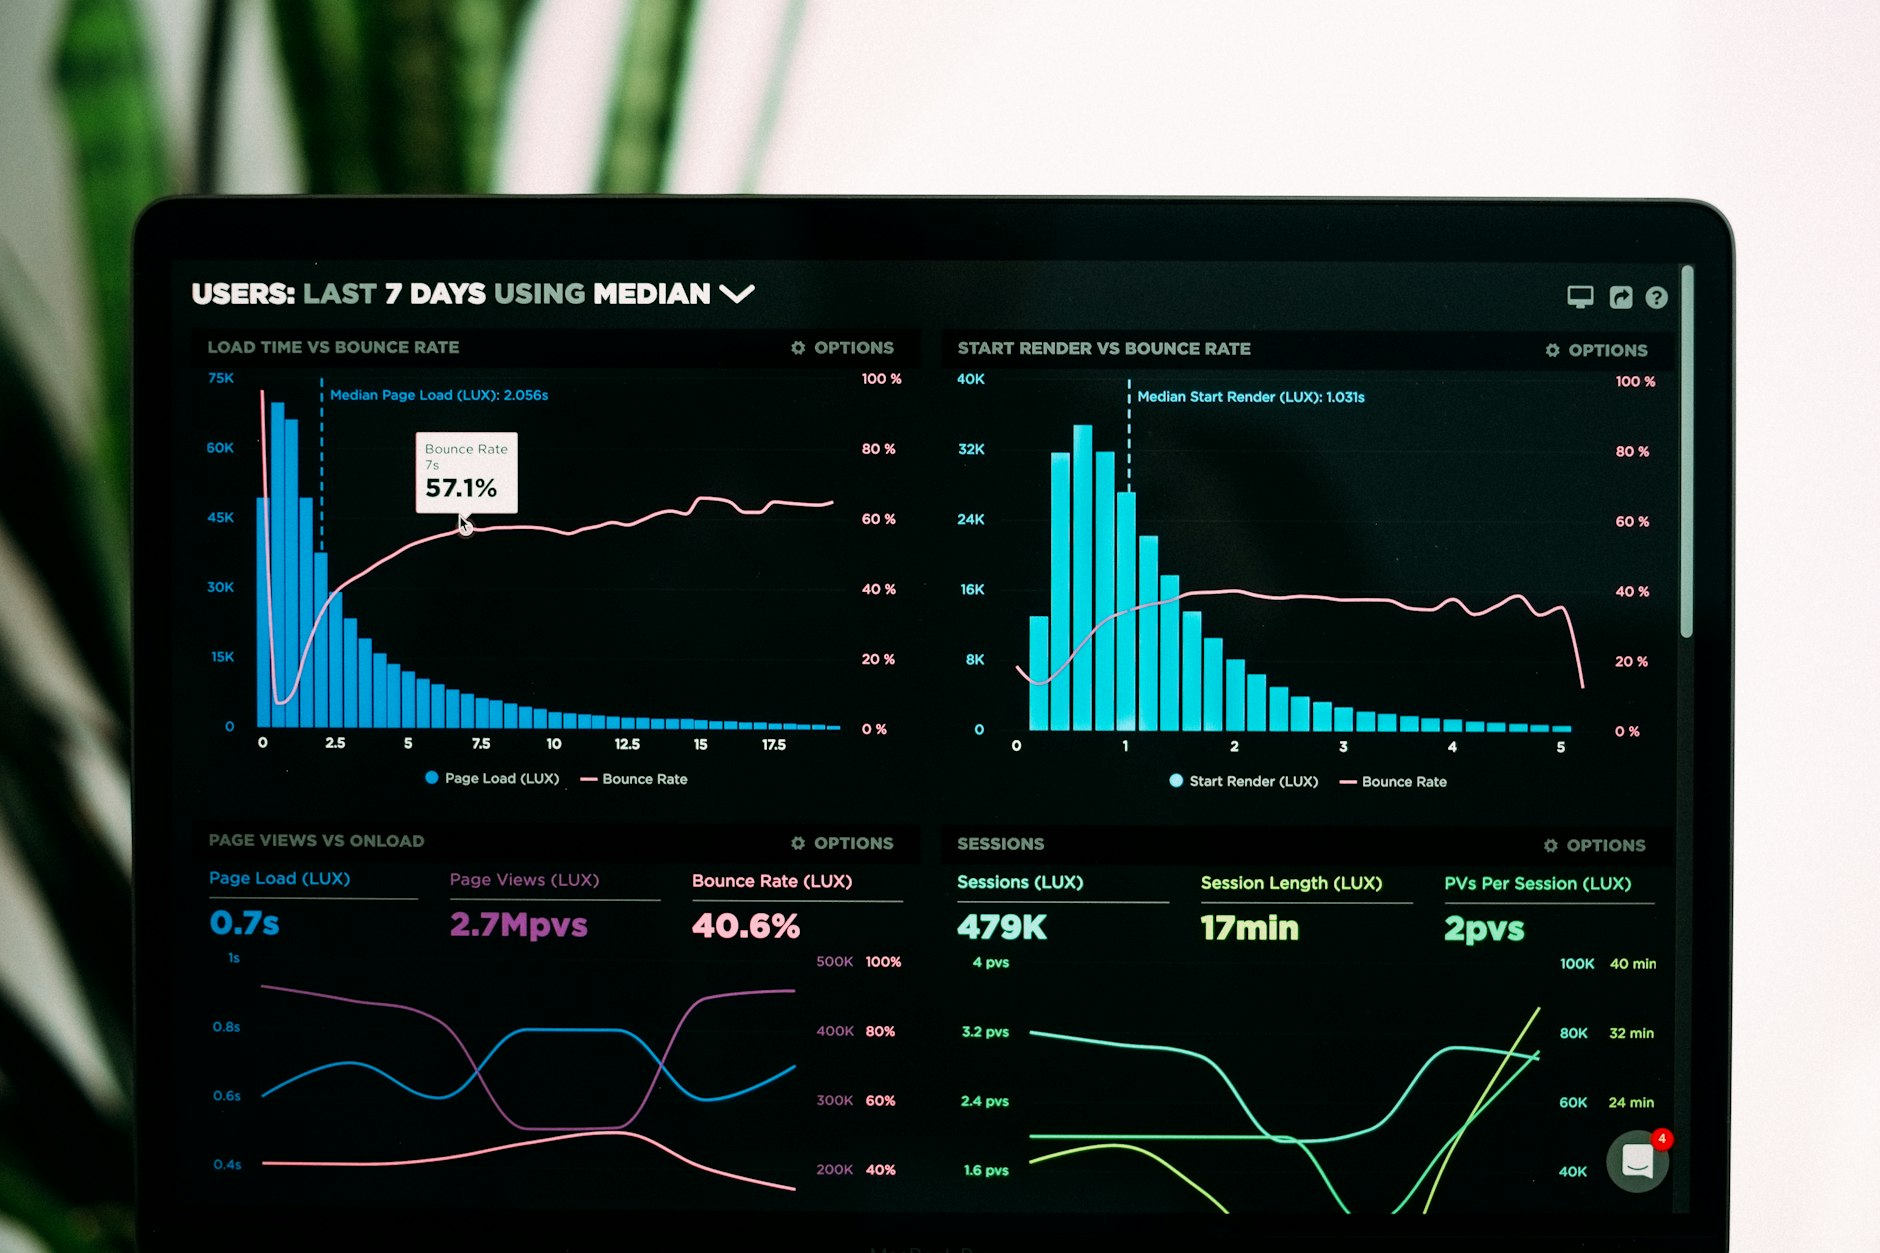
Main dashboard — sessions, revenue, retention
Visualisations
D3.js · Canvas API · WebGL for large datasets
Line charts and area charts are rendered with D3. For datasets exceeding 100 k points the chart switches to a WebGL canvas renderer (regl) to maintain 60 fps. All transitions are 300 ms ease-out.

Funnel analysis — conversion by cohort
Backend
Events are ingested via a Go service into ClickHouse. Aggregations run as materialised views — no on-the-fly GROUP BY queries. The WebSocket server fans out pre-computed JSON diffs to connected clients.
go
// Fanout loop — broadcasts pre-aggregated metrics
func (h *Hub) run() {
  ticker := time.NewTicker(time.Second)
  for range ticker.C {
    metrics := h.store.LatestSnapshot()
    payload, _ := json.Marshal(metrics)
    h.mu.RLock()
    for conn := range h.clients {
      conn.WriteMessage(websocket.TextMessage, payload)
    }
    h.mu.RUnlock()
  }
}